Soluções em Dados para Decisões Estratégicas

Desenvolvemos soluções práticas em Business Inteligence, automação de dados e análises avançadas para apoiar decisões estratégicas e melhorar a eficiência operacional.

A computer screen displaying a coding interface with Python code related to machine learning. The code imports libraries like sklearn and deals with model metrics such as precision and recall. A classification report is shown along with a section titled 'Different meta model trained' listing various models like DT, RF, LR, and XGB. Below, there is code for tuning an XGB model using GridSearchCV.
Two laptops display dark-themed screens; one shows analytical graphs and statistics, including conversion rates, store sessions, and geographic distribution. The other screen displays a grid of web application icons. The scene is dimly lit, emphasizing the glow from the screens and the softly illuminated keyboards.
Business Inteligence e Análise de Dados

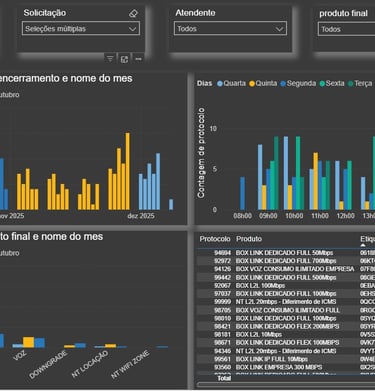
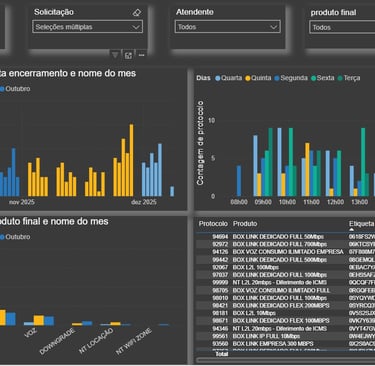
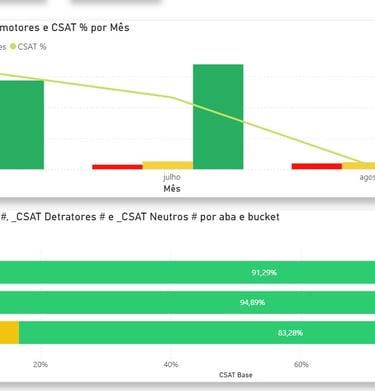
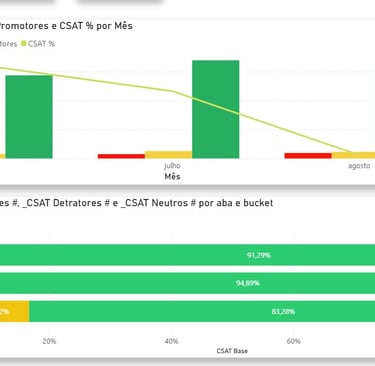
Criamos dashboards analíticos e estratégicos em Power BI, conectando dados de Excel, CRM, sistemas internos e plataformas como Grafana.
As análises são construídas com foco em indicadores que realmente apoiam a tomada de decisão.

Automação de Processos e Dados

Automatizamos rotinas operacionais, integrações entre sistemas e fluxos de dados utilizando Python e boas práticas de engenharia de dados.
O objetivo é reduzir retrabalho, erros manuais e o tempo necessário para gerar relatórios e análises confiáveis.

Two laptops display dark-themed screens; one shows analytical graphs and statistics, including conversion rates, store sessions, and geographic distribution. The other screen displays a grid of web application icons. The scene is dimly lit, emphasizing the glow from the screens and the softly illuminated keyboards.
Soluções em Dados para ISPs

Análise Preditiva e Churn (em desenvolvimento)

Atuamos com análises específicas para ISPs, incluindo massivas, rompimentos, MTTR, recorrência de chamados, qualidade de rede e eficiência operacional.
Transformamos dados técnicos em informações claras para apoiar decisões operacionais e estratégicas.

Estudos e modelos analíticos em Machine Learning para identificar padrões de comportamento, recorrência de problemas e risco de churn em negócios com receita recorrente.

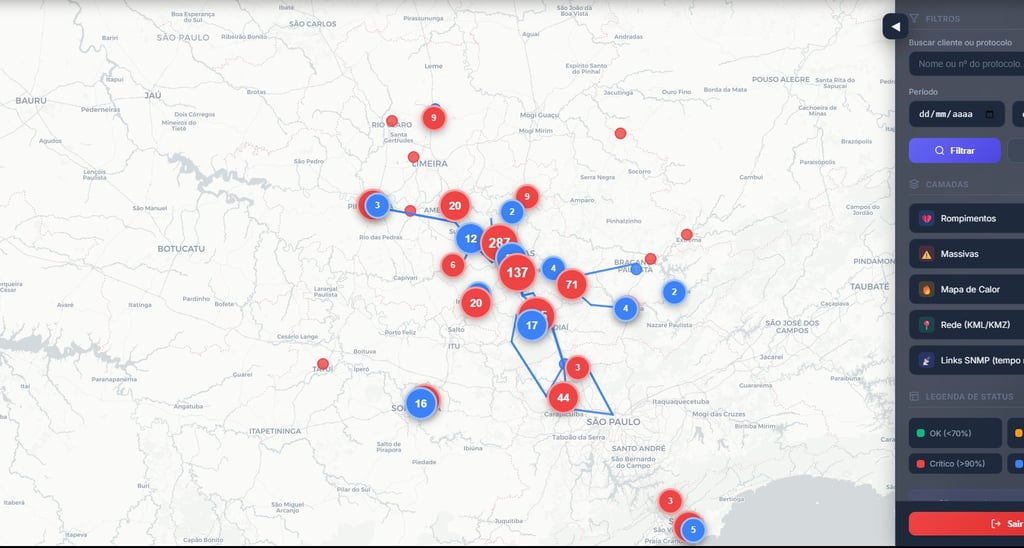
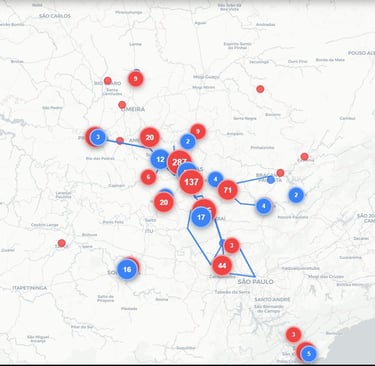
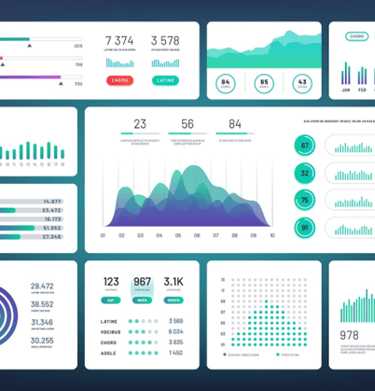
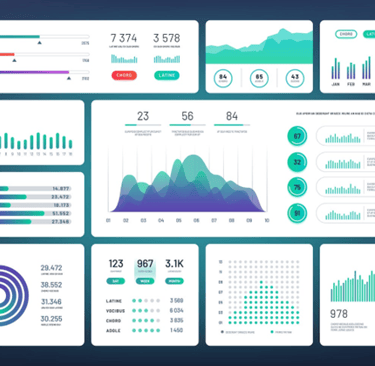
Exemplos de Dashboards e Análises Reais

Visualizações e análises desenvolvidas em projetos reais para apoio à decisão em PMEs e Provedores de Internet.

A laptop displays a detailed financial chart with lines showing data trends. In the background, a person is partially visible, wearing a dark shirt with the words 'most valuable' and some logos printed on it. The setting appears to be a modern workspace.
A laptop on a wooden desk displays a web application interface featuring graphs and statistics. Beside it, a large monitor shows a webpage promoting an all-in-one meeting app. A cup with a recognizable green and white logo sits on the desk.