Transformando Dados em Decisões

Na AM Consultoria, oferecemos soluções inteligentes em análise de dados, automações e visualização com Power BI para ajudar pequenas empresas a tomarem decisões estratégicas baseadas em dados.

A digital dashboard displays metrics related to web performance. Graphs show detailed statistics such as total clicks, total impressions, average click-through rate (CTR), and average position over time. The chart utilizes various colors to distinguish different data sets, and the interface features tabs labeled 'QUERIES', 'PAGES', 'COUNTRIES', 'DEVICES', and 'SEARCH APPEARANCE'.

150+

15

Inovação, Performance, Tecnologia

Dados Poderosos

A AM Consultoria transformou nossos dados em decisões estratégicas. Excelente suporte e soluções inovadoras!

★★★★★

Lines of computer code are displayed on a dark background, featuring SQL and JavaScript syntax with colorful syntax highlighting. The code includes a SQL query and JavaScript function handling datasets.

Galeria

Explore nossas soluções em análise de dados e visualização estratégica.

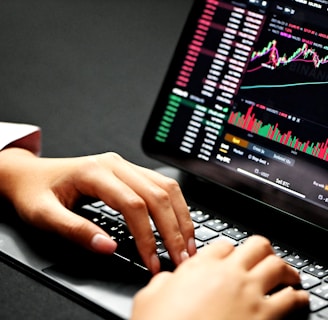
Hands typing on a laptop keyboard with a screen displaying financial graphs and stock market data. Multiple charts and numbers are visible, indicating online trading or financial analysis.
A 3D illustration of a desktop computer setup with a monitor displaying graphs and search icons. Nearby objects include a potted plant, a coffee cup, a magnifying glass, a gear, and a power plug. The scene is set against a monochromatic blue background, emphasizing a digital and modern workspace theme.
A person is holding a smartphone displaying an analytics or insights screen with various metrics and numbers. The individual is wearing a casual white shirt and a watch with a black band. The surrounding environment includes an indoor plant.
A person is working on a laptop at a table, focusing on a software interface displayed on the screen. The interface appears technical or related to programming and data flow. The setting seems to be a modern indoor office or study area with a window in the background.
A laptop displaying a financial dashboard with various stock market graphs and data. The screen shows different stock indices and their performance, including line charts and a bar chart for market overview. The laptop is placed on a light-colored table, and a gray sofa is visible in the background.